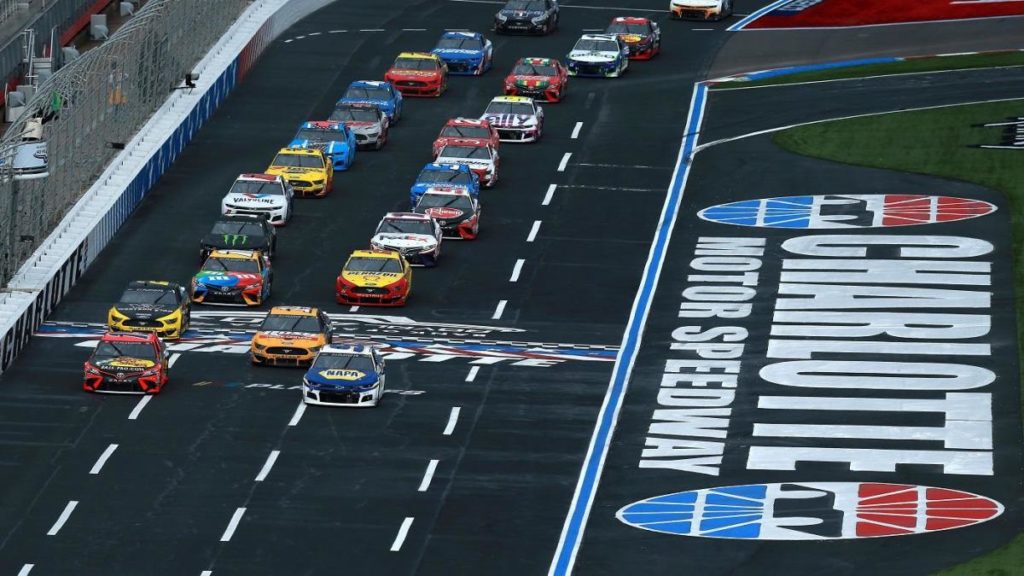
This past weekend’s NASCAR Cup Series race at Sonoma marked the 16th and final run before the 2021 All-Star Race. This coming weekend will see the best drivers in NASCAR compete for a shot at $1 million in the annual All-Star event. Of course, this is a non-points race with the regular season set to resume next weekend in Nashville. As such, it is a good time to visit the updated NASCAR stats and points standings to get a clear picture of how the season is shaping up. After all, when points racing resumes, there will be just ten races remaining before the start of the NASCAR Cup Series Playoffs.
NASCAR Cup Series Standings Update
Refer to the table below for the updated NASCAR Cup Series points standings through the first five races of the season. The table also includes additional NASCAR Cup Series stats including Wins, Top-5 Finishes, Top-10 Finishes and Total Laps Led. The table is sortable by driver and statistic for your viewing convenience.

| Car Number | Driver | Standings Points | Wins | Top-5's | Top-10's | Stage Wins |
|---|---|---|---|---|---|---|
| 22 | Joey Logano | 177 | 1 | 2 | 3 | 1 |
| 20 | Christopher Bell | 176 | 0 | 3 | 4 | 0 |
| 1 | Ross Chastain | 172 | 0 | 1 | 2 | 3 |
| 12 | Ryan Blaney | 161 | 0 | 1 | 3 | 0 |
| 6 | Brad Keselowski | 160 | 0 | 1 | 2 | 1 |
| 4 | Kevin Harvick | 155 | 0 | 2 | 3 | 0 |
| 8 | Kyle Busch | 153 | 1 | 1 | 3 | 0 |
| 19 | Martin Truex Jr. | 145 | 0 | 0 | 1 | 0 |
| 11 | Denny Hamlin | 140 | 0 | 0 | 2 | 0 |
| 99 | Daniel Suarez | 129 | 0 | 1 | 3 | 0 |
| 2 | Austin Cindric | 126 | 0 | 0 | 1 | 1 |
| 47 | Ricky Stenhouse Jr. | 124 | 1 | 1 | 1 | 0 |
| 17 | Chris Buescher | 122 | 0 | 1 | 1 | 0 |
| 7 | Corey LaJoie | 113 | 0 | 1 | 1 | 0 |
| 45 | Tyler Reddick | 111 | 0 | 2 | 2 | 0 |
| 23 | Bubba Wallace | 102 | 0 | 1 | 1 | 0 |
| 16 | A.J. Allmendinger | 92 | 0 | 0 | 1 | 0 |
| 34 | Michael McDowell | 92 | 0 | 0 | 0 | 0 |
| 54 | Ty Gibbs | 90 | 0 | 0 | 1 | 0 |
| 48 | Alex Bowman | 85 | 0 | 2 | 4 | 0 |
| 43 | Erik Jones | 82 | 0 | 0 | 1 | 0 |
| 3 | Austin Dillon | 80 | 0 | 0 | 1 | 0 |
| 14 | Chase Briscoe | 72 | 0 | 0 | 1 | 0 |
| 42 | Noah Gragson | 68 | 0 | 0 | 0 | 0 |
| 38 | Todd Gilliland | 68 | 0 | 0 | 0 | 0 |
| 41 | Ryan Preece | 63 | 0 | 0 | 0 | 0 |
| 10 | Aric Almirola | 63 | 0 | 0 | 0 | 0 |
| 24 | William Byron | 55 | 2 | 2 | 2 | 3 |
| 21 | Harrison Burton | 51 | 0 | 0 | 0 | 0 |
| 51 | Cody Ware | 50 | 0 | 0 | 0 | 0 |
| 9 | Chase Elliott | 49 | 0 | 1 | 1 | 0 |
| 5 | Kyle Larson | 43 | 0 | 2 | 2 | 1 |
| 77 | Ty Dillon | 31 | 0 | 0 | 0 | 0 |
| 31 | Justin Haley | -25 | 0 | 0 | 1 | 0 |
NASCAR Cup Series Stats Update
Refer to the table below which includes several different NASCAR Cup Series stats through the first five races of the season. The table is sortable by driver and statistic for your viewing convenience. Commentary on several notable stats can be found below.
Note: Only drivers running a full-time Cup Series schedule are included in the table.
| Car Number | Driver | Average Finish | Driver Rating | Pass Differential | % Laps Led |
|---|---|---|---|---|---|
| 11 | Denny Hamlin | 8.7 | 107.0 | +81 | 14.1 |
| 5 | Kyle Larson | 10.3 | 108.5 | +237 | 27.3 |
| 22 | Joey Logano | 10.8 | 97.7 | -7 | 6.8 |
| 9 | Chase Elliott | 10.9 | 98.7 | +254 | 4.1 |
| 4 | Kevin Harvick | 11.2 | 90.5 | +57 | 1.9 |
| 18 | Kyle Busch | 11.4 | 99.4 | +133 | 4.4 |
| 24 | William Byron | 11.9 | 97.1 | +64 | 4.5 |
| 2 | Brad Keselowski | 12.6 | 90.9 | +68 | 5.3 |
| 19 | Martin Truex Jr. | 12.8 | 97.6 | +210 | 11.9 |
| 12 | Ryan Blaney | 13.1 | 88.8 | +32 | 5.9 |
| 3 | Austin Dillon | 13.4 | 79.4 | -8 | 0.2 |
| 48 | Alex Bowman | 14.0 | 88.3 | +99 | 3.0 |
| 8 | Tyler Reddick | 14.4 | 79.6 | +46 | 0.4 |
| 20 | Christopher Bell | 16.1 | 84.4 | 0 | 1.1 |
| 1 | Kurt Busch | 17.3 | 81.9 | +60 | 3.6 |
| 17 | Chris Buescher | 17.4 | 71.6 | -134 | 1.5 |
| 42 | Ross Chastain | 17.8 | 74.3 | +25 | 0.8 |
| 21 | Matt DiBenedetto | 17.9 | 72.8 | -129 | 1.1 |
| 34 | Michael McDowell | 18.3 | 65.5 | -79 | 0.5 |
| 47 | Ricky Stenhouse Jr. | 19.0 | 69.2 | +64 | 0.5 |
| 99 | Daniel Suarez | 19.8 | 64.4 | -53 | 1.4 |
| 23 | Bubba Wallace | 20.1 | 68.8 | -15 | 0.9 |
| 14 | Chase Briscoe | 20.5 | 61.7 | -37 | 0.1 |
| 43 | Erik Jones | 21.0 | 60.6 | -24 | 0.1 |
| 10 | Aric Almirola | 21.8 | 64.8 | -72 | 1.1 |
| 6 | Ryan Newman | 21.9 | 59.2 | -156 | 0 |
| 41 | Cole Custer | 22.0 | 60.7 | +19 | 0 |
| 37 | Ryan Preece | 22.1 | 60.1 | +57 | 0.2 |
| 7 | Corey LaJoie | 25.5 | 50.7 | -15 | 0.2 |
| 38 | Anthony Alfredo | 27.2 | 44.3 | -216 | 0.1 |
| 52 | Josh Bilicki | 32.4 | 32.5 | -45 | 0 |
| 00 | Quin Houff | 33.0 | 32.5 | -126 | 0 |
Average Finish
The average finish statistic is the mean finishing position of the drivers across all races in 2021. Although it has been a quiet stretch of races for Denny Hamlin (7.7), he continues to lead all NASCAR Cup Series drivers in this statistic as he has for seemingly the entire year to date. Behind Hamlin, the list has shifted a great deal over the last several weeks. It has been the Hendrick Motorsports show on the track of late. The same can be said for the average finish and NASCAR stats. Chase Elliott (10.1), William Byron (10.6) and Kyle Larson (10.8) line up in order behind Hamlin in this statistic. The fourth Hendrick driver, Alex Bowman (15.6), ranks 13th in average finish on the season but has two wins in his pocket.
Driver Rating
The Driver Rating statistic is often one of the best indicators of exactly how well a NASCAR Cup Series driver is performing. With so much happening within a race, it makes sense to have a quantifiable statistic that is based on a combination of factors. A maximum of 150 Driver Rating points are available in a single race. Of course, it would require a perfect run to obtain a full 150. The Driver Rating formula combines the following:
- Wins
- Finishing Position
- Top-15 Finish
- Average Position While Running on the Lead Lap
- Average Speed Under Green
- Fastest Laps
- Most Laps Led
- Lead-Lap Finishing Position
Once again, we see Denny Hamlin (109.8) holding the line atop this NASCAR stats category. However, things have shifted behind him in the driver rankings as well. On the heels of back-to-back dominant performances at Charlotte and Sonoma, Kyle Larson (108.9) is nipping at the bumper of the No. 11 car to take over the top spot in this statistic. Larson is now one of two NASCAR Cup Series drivers with three victories on the season to date. The other, Martin Truex Jr. (102.4) ranks third in driver rating. Joey Logano (102.4) and William Byron (100.5) round out the shortlist of five drivers with average ratings of 100 or better this season.
Pass Differential
The Pass Differential statistic indicates how many positions a driver has won or lost by way of passing over the course of a race. Those who have completed a greater number of green flag passes than they have been passed will have a positive number in this NASCAR Cup Series stats category. On the contrary, a driver who has been passed more times than he has passes completed will have a negative number.
🔊 Listen to Burnt Rubber Racing on wherever you get your podcasts!
It comes as no surprise that a Hendrick Motorsports driver sits atop this NASCAR stats category. That said, some might be surprised to see Chase Elliott (+191) with a sizable lead over Kyle Larson (+158) in pass differential. There is an explanation for this though. For as dominant as Larson has been, he has spent so much time leading races recently that he has not had to make as many passes.
A pair of Joe Gibbs Racing drivers in Kyle Busch (+123) and Martin Truex Jr. (+112) are the only other two with a pass differential greater than 100 through the season’s first 16 races. A couple of other drivers with strong showings in this category include Alex Bowman (+94), Tyler Reddick (+65) and Ryan Preece (+42). Being fast while racing under green is always something to note!
Percentage of Laps Led
The percentage of laps led is calculated by dividing the sum of laps that a driver has led by the total number of laps that they have completed. It comes as no major shock that Kyle Larson holds a sizable lead in this NASCAR stats area. After dominating each of the last two races from start to finish, the No. 5 car has now led 28.6% of laps, good for over a quarter of the laps run this season. Although he hasn’t spent a lot of time out front recently, Denny Hamlin (17.6%) remains second on this list.
The only other driver to lead more than 10% of laps on the year is Hamlin’s JGR teammate, Martin Truex Jr. (14.8%). Things drop off quickly after that with just two more drivers having turned greater than 5% of all circuits out in front. Both Joey Logano (8.3%) and Ryan Blaney (5.6%) drive for Team Penske.
