If you are like me, you probably can’t get enough information about fantasy football, or for that matter, fantasy sports in general. Truth be told, I probably spend too much time pouring over statistics and player data and I’m quite certain that my friends think I’ve become an absolutely boring and sports-obsessed donkey. While I am not a pro, it hasn’t stopped me from trying to learn everything possible about how to become a better fantasy player.
When I first started playing fantasy sports on a regular basis three years ago, I became fixated on trying to make accurate predictions and chased that big purple dragon round and round for almost two years. My efforts only resulted in me breaking even most of the time. However, the past year I decided to take a different approach and I’ve spent a great deal of time trying to look at fantasy sports from a different perspective.
This has led me to start reading more books and less of the usual “Start-Sit” type columns. Not that there is anything wrong with those types of articles (especially here at FlurrySports). Often times, they can provide us with useful insights or information that we may not have otherwise considered. When it comes to GPPs, however, they can also lead to playing too much chalk and can affect your ability to think for yourself, if you aren’t careful.
As season long and daily fantasy players, we need to be aware of the nuances of entering each type of contest and use every means at our disposal to try and gain an advantage over the field. I’m insanely competitive and I don’t just want to win my league or contest; I want to crush the competition and do it on a consistent basis and make some cold hard cash along the way. When it comes to daily fantasy contests, my particular interest is in GPPs, and consistent success in these types of contests requires a different way of thinking and becoming aware of the methods that our brains use to play tricks on us.
Fantasy Football for Smart People
As a result, I recently purchased a copy of “Fantasy Football for Smart People – The Hidden Psychology of Winning DFS” by Jonathan Bales. If you’ve played fantasy sports regularly, you’ve probably heard his name before. Based on the title, I’m surprised Amazon allowed me to buy a copy, but I digress. If you want to become a better fantasy player, I highly recommend any of Jonathan’s books (and no…he is not paying me to say that).
While Bales provides a number of truly informative statistics and historical DFS trends that are well worth the cover price of the book, I have always been interested in understanding how people think and I found his chapter on different types of cognitive biases particularly fascinating. While the book is mainly geared towards GPPs and 50/50 contests, much of the information can also be applied to season long leagues as well.
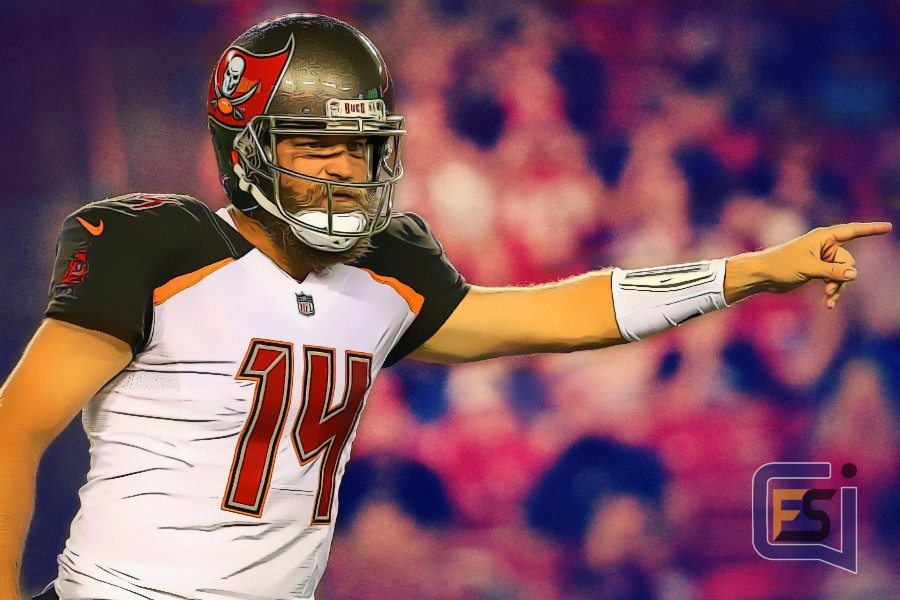
As I finished licking my wounds from Week 1 (I had Ryan Fitzpatrick and DeSean Jackson in my initial lineups last week and traded them out for Mitchell Trubisky and Allen Robinson – I know, I’m a dumbass) and began my research for Week 2, I immediately thought back to his explanation of the “Hot-Hand Fallacy,” which is somewhat similar to “Recency Bias.” By definition, the Hot-Hand Fallacy is “the fallacious belief that a person who has experienced success with a random event has a greater chance of further success in additional attempts.” Of course, this is also somewhat tied to recency bias, which is simply our tendency as humans to most strongly remember more recent events while forgetting or ignoring events that occurred further in the past.
Consequently, I began to wonder how the top-10 finishers at each position in Week 1 of previous seasons performed in the subsequent week. To examine this, I pulled DraftKings pricing and scoring data from the web for each positional group and created a simple spreadsheet to compare fantasy points from Week 1 and Week 2 in both 2016 and 2017. The tables shown below illustrate these results, and the information is telling.
Let’s start with quarterbacks. DraftKings scoring and pricing from Week 1 and Week 2 in 2017 is shown in Table 1.1 below, while Table 1.2 includes data from 2016.
Table 1.1 – 2017 DRAFTKINGS POINTS AND SALARIES FROM WEEK 1 TO WEEK 2
QUARTERBACK
As can be seen in the table above, only three of the top-10 quarterbacks from Week 1 finished as such in Week 2 (these players have been highlighted in green). In the section labeled “Difference from Week 1 to Week 2,” we can see the fantasy point difference, the difference as a percentage, and the changes in player pricing from one week to the next.
As Bales details in the book, DFS sites like DraftKings tend to rely on recent performance as one part of their pricing algorithm, and they often overcompensate. As the 2017 data shows, all but three of the Top 10 QBs from Week 1 saw a price increase and almost all of these players had significant drop offs in fantasy production. For example, in Week 1 last year, Alex Smith produced the highest fantasy score with 34.02 fantasy points. The following week, his price jumped by $300 but his fantasy points in Week 2 dropped by 17.88 points which was a 52.6% drop in fantasy production.
Equally as telling, let’s look at the QBs that finished ranked 11-20 in Week 1. Eight of these ten players saw their price stay the same or go down and five of these same players saw their fantasy production increase the very next week. As a group, seven of the QBs that finished ranked 11-20 actually scored more points in Week 2 regardless of their price change and five of these seven finished in the Top 10. Of course, seeing this pattern forced me to also look at data from 2016 to see if a similar pattern would emerge. The data for 2016 is shown in Table 1.2 below.
Table 1.2 – 2016 DRAFTKINGS POINTS AND SALARIES FROM WEEK 1 TO WEEK 2
QUARTERBACK
Unlike 2017, seven of the Top-10 QBs on DraftKings in Week 1 of 2016 actually saw their prices drop in Week 2. Since I don’t have access to DraftKings’ pricing algorithm, this result came as a surprise and to be totally honest, I’m not sure what to make of it. It could be that DraftKings changed their pricing algorithm between the 2016 and 2017 seasons or perhaps the prices of these players dropped based on the Week 2 matchups. Nevertheless, just as in 2017, eight of the ten quarterbacks that finished ranked 11-20 in Week 1 of 2016 also saw their prices drop in Week 2. Six of these eight players scored more fantasy points in Week 2 and four of them finished in the Top 10.
The Main Point
Although I won’t go through every position in this amount of detail, here is the main point of this analysis. As season long and daily fantasy players, we must be cognizant of our tendency to rely too heavily on recent results. While each week of the football season isn’t an absolutely independent random event akin to each spin of a roulette wheel or flipping a coin, we should approach each week of the football season as its own unique puzzle that needs to be solved independently of the fantasy points scored by each player the previous week. Moreover, if we know that our brains work this way and that other fantasy players will fall victim to this line of thinking, we can use this to our advantage.
Often times, the difference between a player finishing Top-10 or finishing in the Top-30 could come down to one shoe string tackle or a missed red zone opportunity. How many times have we all watched a stud wide receiver or running back get tackled at the one yard line or drop an easy TD pass and finish with 12 to 15 fantasy points instead of 22 to 25? It happens every week.
To combat the tendency to rely too heavily on recent events and fall victim to recency bias or the hot-hand fallacy, Bales suggests that we should always “be looking for little indicators that a player’s recent production isn’t what it seems.” In other words, has a “hot” wide receiver scored a ton of fantasy points on limited opportunities because they have been overly efficient or lucky or are they actually seeing significant volume that allows the production to happen again in the future? As Bales suggests, “what we should be looking for is players who have had ample opportunities to produce fantasy points.” He goes on to add that “the big factor to consider is opportunities. Although there can be big differences in player talent, opportunity is still king in fantasy football.”
As we saw in each of the quarterback tables above, I believe “opportunity” is the operative word here and might help explain why QBs that finish ranked 11-20 generally do better in the subsequent week. Opportunities for QBs are generally consistent and results can vary based on game flow and strength of the opposing defense. In addition, we need to realize that football is a high variance game that while somewhat predictable, can change drastically from week-to-week based on outlier or fluky events.
In conclusion, the Week 1 to Week 2 comparisons for each position can be found below. However, if you play fantasy football with any regularity and only take one thing from this article, be aware of the affect that recency bias and the hot-hand fallacy can have on your decision-making process. Every time we select a player for our lineups, we need to consider the number of opportunities that each player will have to score fantasy points and make our roster decisions accordingly.
The results for the other positional groupings can be found below.
Table 2.1 – 2017 DRAFTKINGS POINTS AND SALARIES FROM WEEK 1 TO WEEK 2
RUNNING BACK
Table 2.2 – 2016 DRAFTKINGS POINTS AND SALARIES FROM WEEK 1 TO WEEK 2
RUNNING BACK
Table 3.1 – 2017 DRAFTKINGS POINTS AND SALARIES FROM WEEK 1 TO WEEK 2
WIDE RECEIVER
Table 3.2 – 2016 DRAFTKINGS POINTS AND SALARIES FROM WEEK 1 TO WEEK 2
WIDE RECEIVER
Table 4.1 – 2017 DRAFTKINGS POINTS AND SALARIES FROM WEEK 1 TO WEEK 2
TIGHT END
Table 4.2 – 2016 DRAFTKINGS POINTS AND SALARIES FROM WEEK 1 TO WEEK 2
TIGHT END
Table 5.1 – 2017 DRAFTKINGS POINTS AND SALARIES FROM WEEK 1 TO WEEK 2
DEFENSE
Table 5.2 – 2016 DRAFTKINGS POINTS AND SALARIES FROM WEEK 1 TO WEEK 2
DEFENSE


